Introduction to data visualization in Python

Information
The estimated time to complete this training module is 3h.
The prerequisites to take this module are:
- Installations
- Introduction to python for data analysis module.
Contact Natasha Clarke if you have questions on this module, or if you want to check that you completed successfully all the exercises.
Resources
This module was presented by Jacob Vogel during the QLSC 612 course in 2020, and the associated notebook is available here. (Note: if you did the BIDS module, the dataset to download is the same - ds000228! A few functions now throw warnings, you can ignore these, or fix them if you like.)
The video of the presentation is available below (1h09):
Tutorial
- Download the jupyter notebook (save raw version from Github), or start a new jupyter notebook
- Watch the video and run the cells in the notebook
Exercice
For this next part, we will refer to the following notebook.
For example purposes, we will make use of a phenotypic dataset from the ABIDE II consortium. This amazing international multi-site dataset contains data from individuals diagnosed with Autism Spectrum Disorder (ASD) and healthy controls. We will use a version of the phenotypic data from a single site (Kennedy Krieger Institute). To download the dataset, click on the link and then ‘Kennedy Krieger Institute’ on the right-hand side. Then, Downloads -> Phenotypic File. You will need an NITRC account - if you don't have one, you can create one in a few minutes here.
- Read through the notebook running all the cells
- Complete the exercises in the notebook
Exercise 1 Create a figure with a single axes and replot the second scatterplot to group by sex instead of dx_group.
   Set the figure size to a ratio of 8 (wide) x 5 (height)
   Use the colors red and gray
   Set the opacity of the points to 0.5
   Label the axes
   Add a legend
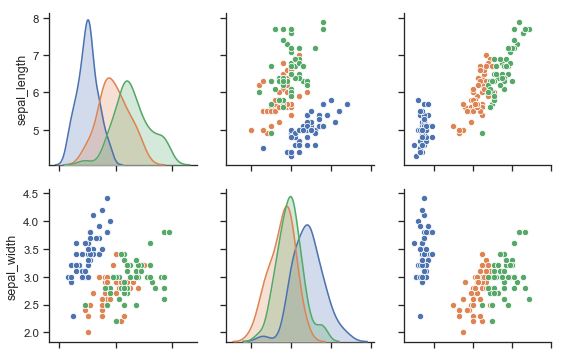
Exercise 2 Using a pairwise plot, compare the distributions of age, viq, and piq with respect to dx_group.
    Set a palette
    Set style to ticks
    Set context to paper
    Suppress the dx_group variable from being on the plot
Exercise 3 Using a violin plot separate out viq as a function of sex and dx_group.
    Different dx_group should be on each half of each violin
    The x-axis should reflect the different sex categories.
Exercise 4 Play around and make an interactive plot using plotly and your project data if you have any.
- Follow up with Natasha Clarke to validate you completed the exercise correctly.
- 🎉 🎉 🎉 you completed this training module! 🎉 🎉 🎉
More resources
- Other great resources to get started with plotting in python:
Interactive plotting
Gallery